Climate change is creating more intense hurricanes to form. In turn, they bring more intense weather events on shore, increasing the likelihood that rivers will experience more precipitation than they can handle.
read more – copyright by massivesci.com
 It’s hard to grow up in the northeastern Pennsylvania’s Wyoming Valley without knowing the details of the ’72 flood by heart. The water was so strong it uprooted a section of the historical Forty Fort cemetery at its bend, leaving caskets floating in the streets and body parts on porches and in basements. To this day, my mother describes what it was like to be chased from her home when the Susquehanna River rushed through narrow, city streets.
Over 220,000 people were left stunned and homeless for years.
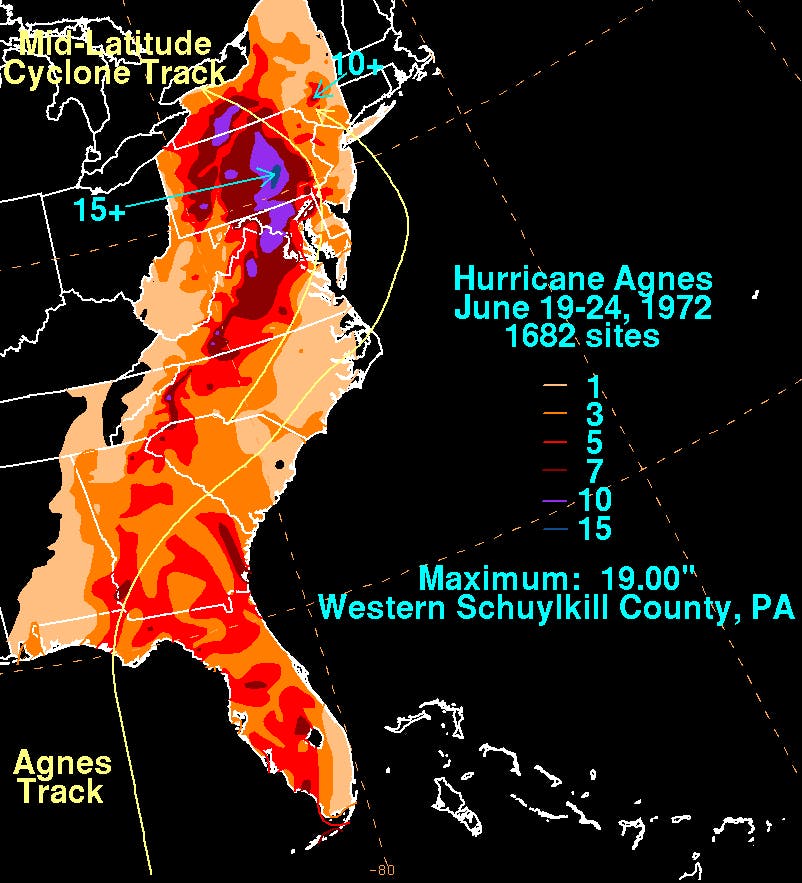
Climate change is creating more intense hurricanes to form. In turn, they bring more intense weather events on shore, increasing the likelihood that rivers will experience more precipitation than they can handle. Hurricane Agnes, the Atlantic hurricane that caused the ’72 flood, stalled over Pennsylvania as a Tropical Storm and dumped over 12 inches of rain on Harrisburg, a the capital city along the Susquehanna River in less than 24 hours. Hurricane Agnes, the Atlantic hurricane that caused the ’72 flood, stalled over Pennsylvania as a Tropical Storm and dumped over 15 inches of rain in and around the Wyoming Valley.
In an article published last year in Scientific Reports , a collaboration of scientists from around the United States present the first use of machine learning to identify atmospheric circulation patterns associated with extreme river floods, such as the flood of ’72. The scientists, Katherine Schlef, Hamid Moradkhani, and Upmanu Lall hope that this technology will allow them to better understand what causes extreme floods on a continental scale.
The group formed self-organizing maps (SOMs), a machine learning tool that defines groups of data. The program looks for patterns and uses this information to rapidly sort new data points.
The researchers performed the most in depth analysis of extreme river flooding in the contiguous United States to date. They divided the country into three regions: West (from the Pacific to near the Mississippi River), Central (from the Mississippi to the Appalachians), and East (everything east of Appalachia). For each region, they collected past atmospheric patterns associated with flooding events to classify floods into groups. They only used record floods to develop the groups of atmosphere patterns and then assigned all other as “peaks-over-threshold” (POT) floods.
Both record and POT floods are extreme floods. Record floods are the worst ever in a region, while POT floods are all the others that are really bad without breaking records. The group used record floods (169 in the West, 316 in Central, and 196 in the East) to develop the SOMs, the machine learning maps. Then, they assigned the remaining POT floods (1,223 in the West, 2,183 in Central, and 1,467 in the East) into the groups created by the record floods.
Thank you for reading this post, don't forget to subscribe to our AI NAVIGATOR!
Based on the machine’s clustering performance, the West region has five circulation patterns associated with extreme floods, the Central region has three, and the East region has four.[…]
read more – copyright by massivesci.com


Climate change is creating more intense hurricanes to form. In turn, they bring more intense weather events on shore, increasing the likelihood that rivers will experience more precipitation than they can handle.
read more – copyright by massivesci.com
Over 220,000 people were left stunned and homeless for years.
Climate change is creating more intense hurricanes to form. In turn, they bring more intense weather events on shore, increasing the likelihood that rivers will experience more precipitation than they can handle. Hurricane Agnes, the Atlantic hurricane that caused the ’72 flood, stalled over Pennsylvania as a Tropical Storm and dumped over 12 inches of rain on Harrisburg, a the capital city along the Susquehanna River in less than 24 hours. Hurricane Agnes, the Atlantic hurricane that caused the ’72 flood, stalled over Pennsylvania as a Tropical Storm and dumped over 15 inches of rain in and around the Wyoming Valley.
In an article published last year in Scientific Reports , a collaboration of scientists from around the United States present the first use of machine learning to identify atmospheric circulation patterns associated with extreme river floods, such as the flood of ’72. The scientists, Katherine Schlef, Hamid Moradkhani, and Upmanu Lall hope that this technology will allow them to better understand what causes extreme floods on a continental scale.
The group formed self-organizing maps (SOMs), a machine learning tool that defines groups of data. The program looks for patterns and uses this information to rapidly sort new data points.
The researchers performed the most in depth analysis of extreme river flooding in the contiguous United States to date. They divided the country into three regions: West (from the Pacific to near the Mississippi River), Central (from the Mississippi to the Appalachians), and East (everything east of Appalachia). For each region, they collected past atmospheric patterns associated with flooding events to classify floods into groups. They only used record floods to develop the groups of atmosphere patterns and then assigned all other as “peaks-over-threshold” (POT) floods.
Both record and POT floods are extreme floods. Record floods are the worst ever in a region, while POT floods are all the others that are really bad without breaking records. The group used record floods (169 in the West, 316 in Central, and 196 in the East) to develop the SOMs, the machine learning maps. Then, they assigned the remaining POT floods (1,223 in the West, 2,183 in Central, and 1,467 in the East) into the groups created by the record floods.
Thank you for reading this post, don't forget to subscribe to our AI NAVIGATOR!
Based on the machine’s clustering performance, the West region has five circulation patterns associated with extreme floods, the Central region has three, and the East region has four.[…]
read more – copyright by massivesci.com
Share this: