Conventional metrics used to evaluate stocks may not apply to technology stocks.
copyright by seekingalpha.com
 We used machine-learning techniques to analyze the associations between over a hundred financial metrics and historical stock returns in the technology sector.
We summarize the results of our analysis, which identified the 7 best metrics to evaluate technology stocks today.
Based on our analysis, the best metrics to evaluate technology stocks include: the P/S ratio, beta, net income growth, free cash flow growth, market cap, R&D expense growth and SG&A to revenue.
Thanks to technological advances, calculations that would have taken computers 7 years in 1991 can be accomplished in less than 1 second today. With such a rapid pace of technological advances, it’s no wonder that tech stocks have provided such amazing returns for investors.
That being said, technology stocks can be difficult to evaluate. For instance, many technology stocks either have negative earnings or trade at sky-high P/E ratios. Evidence suggests metrics conventionally used to evaluate stocks may not be applicable to technology stocks. As such, we performed an extensive analysis to uncover the best metrics to evaluate technology stocks.
In our analysis, we explored the association between over a hundred financial metrics and historical stock returns in the technology sector using a powerful machine learning technique known as bootstrapped regularized lasso regression. In this article, we present the 7 best metrics to evaluate technology stocks that we uncovered during our analyses.
Methodology
We include this section for readers interested in how the data is derived. For the results of our analysis, skip to the next section.
Thank you for reading this post, don't forget to subscribe to our AI NAVIGATOR!
For this analysis, we used over a decade of historical financial, market and price data. To derive the best metrics to evaluate technology stocks, we used bootstrapped regularized lasso regression to determine the linear association between over a hundred financial metrics and a binary indicator of strong annual returns relative to the overall market. The S&P 500 index was used as a surrogate marker of overall market performance. Furthermore, to normalize the distributions of financial metrics with heavily skewed distributions, we used a log transformation, and all covariates were standardized.
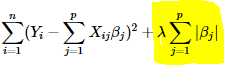
Bootstrapped regularized lasso regression is an excellent technique to gain inference from data. In fact, it is one of the only machine-learning techniques that allows you to gain an understanding of how the model works. Without delving into the mathematics, regularized lasso regression introduces a regularization term (highlighted in yellow in the equation below) to its cost function, which both improves the accuracy of the model and eliminates less important financial metrics from the model.
Furthermore, by bootstrapping regularized lasso regression, we were able to train a thousand models from our original dataset and to set our final model to the average across all trained models. Finally, we restricted our analysis to financial metrics identified as important in >80% of trained models. This process ensured that our findings had increased reliability and better interpretability.[…]
read more – copyright by seekingalpha.com


Conventional metrics used to evaluate stocks may not apply to technology stocks.
copyright by seekingalpha.com
We summarize the results of our analysis, which identified the 7 best metrics to evaluate technology stocks today.
Based on our analysis, the best metrics to evaluate technology stocks include: the P/S ratio, beta, net income growth, free cash flow growth, market cap, R&D expense growth and SG&A to revenue.
Thanks to technological advances, calculations that would have taken computers 7 years in 1991 can be accomplished in less than 1 second today. With such a rapid pace of technological advances, it’s no wonder that tech stocks have provided such amazing returns for investors.
That being said, technology stocks can be difficult to evaluate. For instance, many technology stocks either have negative earnings or trade at sky-high P/E ratios. Evidence suggests metrics conventionally used to evaluate stocks may not be applicable to technology stocks. As such, we performed an extensive analysis to uncover the best metrics to evaluate technology stocks.
In our analysis, we explored the association between over a hundred financial metrics and historical stock returns in the technology sector using a powerful machine learning technique known as bootstrapped regularized lasso regression. In this article, we present the 7 best metrics to evaluate technology stocks that we uncovered during our analyses.
Methodology
We include this section for readers interested in how the data is derived. For the results of our analysis, skip to the next section.
Thank you for reading this post, don't forget to subscribe to our AI NAVIGATOR!
For this analysis, we used over a decade of historical financial, market and price data. To derive the best metrics to evaluate technology stocks, we used bootstrapped regularized lasso regression to determine the linear association between over a hundred financial metrics and a binary indicator of strong annual returns relative to the overall market. The S&P 500 index was used as a surrogate marker of overall market performance. Furthermore, to normalize the distributions of financial metrics with heavily skewed distributions, we used a log transformation, and all covariates were standardized.
Bootstrapped regularized lasso regression is an excellent technique to gain inference from data. In fact, it is one of the only machine-learning techniques that allows you to gain an understanding of how the model works. Without delving into the mathematics, regularized lasso regression introduces a regularization term (highlighted in yellow in the equation below) to its cost function, which both improves the accuracy of the model and eliminates less important financial metrics from the model.
Furthermore, by bootstrapping regularized lasso regression, we were able to train a thousand models from our original dataset and to set our final model to the average across all trained models. Finally, we restricted our analysis to financial metrics identified as important in >80% of trained models. This process ensured that our findings had increased reliability and better interpretability.[…]
read more – copyright by seekingalpha.com
Share this: